Menu Windows
Custom multiplier windows
Windows for non-standard multipliers are shown at the top of the menu.
Examples are "Worked AGB" in AGB contests, "IT provinces" in ARI DX, etc.
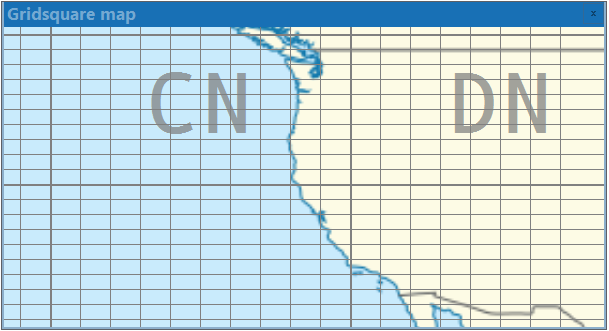
Worked gridsquares
Shortcut: [Alt][L]
This selection is only available when relevant for the contest.
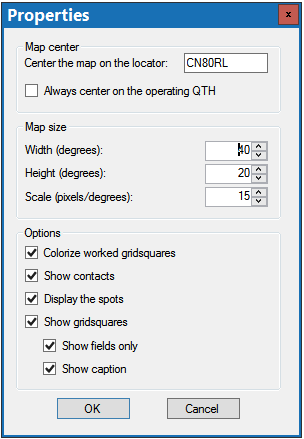
Right click on the map and select Properties to open the settings form:
This form allows customization for your particular area and contest.
Worked Zones
Shortcut: [Alt][Z]
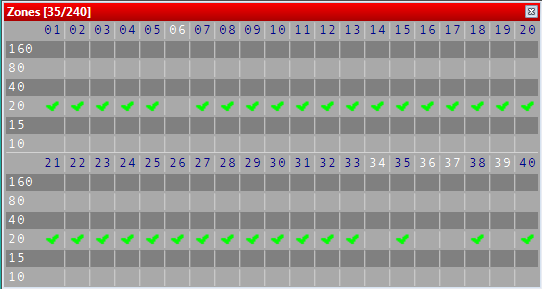
Worked zones window.
The title of this menu item will fit to the chosen contest.
The window displays the worked multipliers (in blue) or not (in white) on the current band, and possibly the current mode.
Also ff the contest is multi-bands and/or multi-modes, you can display the distribution of these multipliers by band (and/or mode).
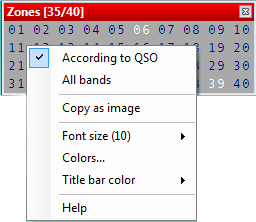
To change to by band, right mouse click on the zones window for the context menu and select all bands.
Right mouse click on the zones window for the context menu.
Zones window can be copied as an image to save for later use or paste into an email from the context menu.
Note: this selection is only be available if enabled by the current contest.
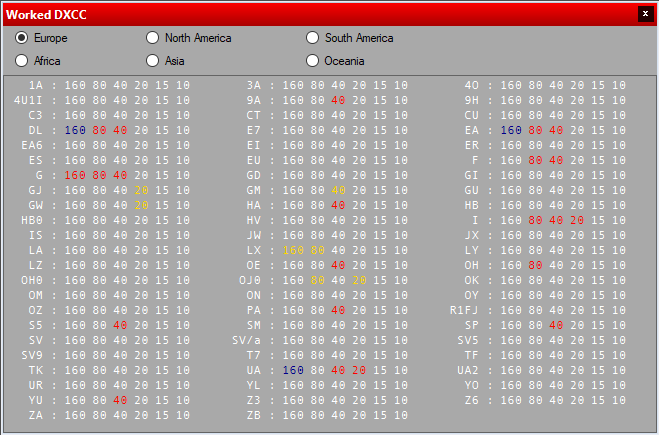
Worked DXCC
Shortcut: [Alt][M]
If one DXCC country has been worked on a band (possibly a mode), this band will be displayed
in blue (default), otherwise it remains in white (white). This window is resizeable.
Continents are selected from the radio buttons at the top of the screen. The window's content
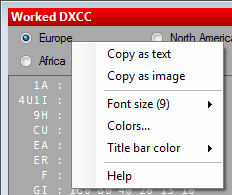
can be copied as text or a png image to the Windows clipboard and pasted into any
Windows application.
Display of spotted (default red) and expected (default yellow) DXCC is only be available
if enabled with Options->Statistics files.
Worked prefixes
Shortcut: [Alt][P]
Shows worked prefixes if enabled by contest. Note: this selection is only be available if enabled by the current contest.
Check callsign
Shortcut: [F9]
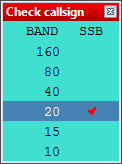
This window displays a checkmark if and on which bands a specific callsign has been logged before.
Depending on the type of the contest, the display may show more than one column to display the different possible modes.
You can double-click a check mark to jump to the QSO in your log.
Check multipliers
Shortcut: [F10]
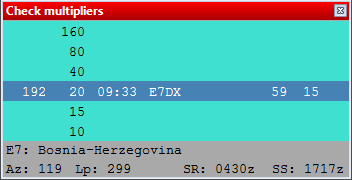
When a callsign or country prefix is entered this window will indicate whether this multiplier has
been worked or not on the current (highlighted by a blue line) or other bands (and in other modes if the contest rules permit).
If the callsign entered has been worked on other bands, DXlog displays those QSOs.
Otherwise, the callsign of the first station worked in that multiplier on that band is displayed, if any.
If the contest has overlapping multipliers, meaning multipliers can be double (or even triple), only the first multiplier will be displayed in the window.
Additional information about the multiplier's country is displayed at the bottom:
- Official country prefix and name
- Average short (Az) and long path (Lp) antenna headings
- Sunrise (SR) and sunset (SS) times
The update timing of the Check multipliers window is controlled by Tools|Data Entry|Exchange Guessing.
- Pressing the space bar - information will be displayed when you press the spacebar.
- Automatically - Information will be displayed while you are typing the call-sign.
- After timeout - information will be displayed automatically after few seconds of filling in the call-sign field.
You can double-click on a line to jump to the corresponding QSO in your log.
Check partials
Shortcut: [F12]
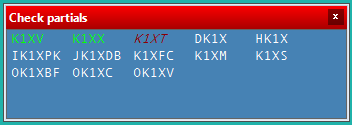
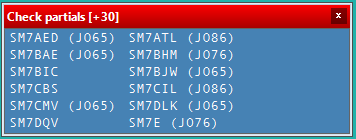
With three or more characters entered, the Check partials window will show all callsigns
in the master callsign database that includes the entered string.
DXLog's master callsign data base contains the callsigns from all active prefill databases
together with those from the public check partials database.
With the default color settings, white callsigns are not in log, green callsigns are worked on another
band, and red callsigns are dupes. A bold callsign is an exact match.
A callsign can be grabbed to the entry field by double clicking on it.
The callsign in the upper left corner can be grabbed by pressing [Alt][Y].
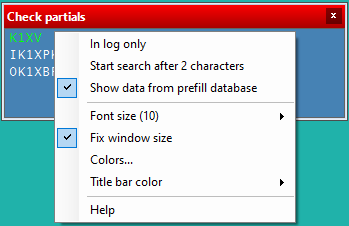
Right-clicking the window will display the context menu. Search can be started after only two characters
entered (not recommended), search can be limited to only the log, and prefill data can be displayed.
If more than one database is used, the values from each database are separated by slash "/".
Reverse look-up
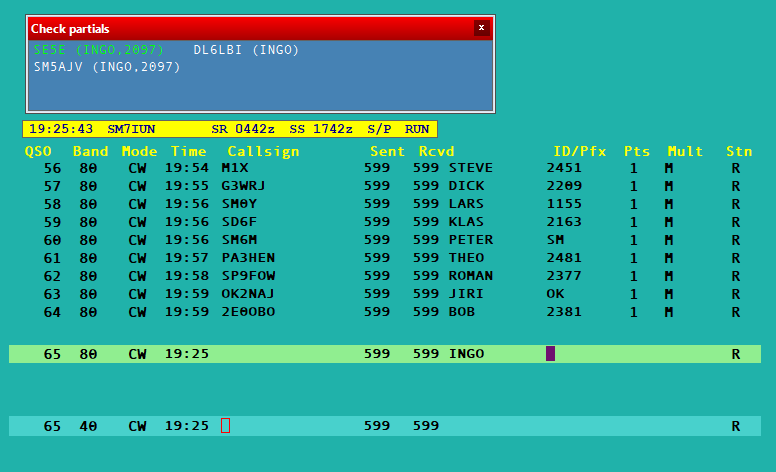
The Check Partials window is also where results from a reverse look-up is shown.
On supported contests, the call sign associated with an exchange can be displayed.
When only one one of the two first exchange fields is populated, pressing [Space]
will trigger a reverse look-up. DXlog will search for the entered exchange in all active
prefill data bases and show the matching callsigns in the Check Partials window.
In the picture below, the context menu option Show data from prefill database is also enabled.
Check partials 2
The Check Partials 2 window behaves in the same way as the Check Partials window. If both windows
are open the Check Partial window will show the information for Radio 1 if SO2R and VFO A if SO2V
and the Check Partial 2 window will show the information for Radio 2 if SO2R and VFO B if SO2V.
Check N+1
Shortcut: [F8]
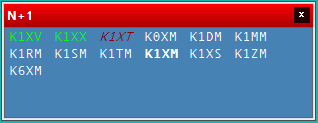
With at least three 3 characters are entered in the callsign entry field, the Check N+1 window will list all
callsigns from the super check partial database having a Damerau-Levenshtein distance of 1 or less.
In plain English this means all callsigns in the valid callsign database that can be created by either
removing a character, adding a character, or swapping two characters in the entered callsign.
With the default color settings, white callsigns are not in log, green callsigns are worked on another
band, and red callsigns are dupes. A bold callsign is an exact match.
A callsign can be grabbed to the entry field by double clicking on it.
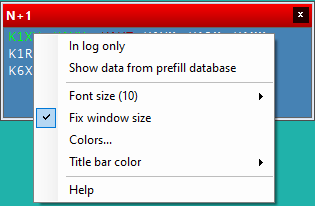
Right mouse click on the window shows the context menu. Optionally, search can be limited to only the current
log and content from an active prefill database can be displayed.
Check N+1 2
The Check N+1 2 window behaves in the same way as the Check N+1 window. If both windows are
open the Check N+1 window will show the information for Radio 1 if SO2R and VFO A if SO2V and
the Check N+1 2 window will show the information for Radio 2 if SO2R and VFO B if SO2V.
Search and Pounce
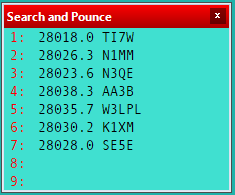
The Search and Pounce window serves as a scratchpad, remembering stations with their frequency.
For instance you may find a rare multiplier but you may want to try again a bit later when
the pile-up is less intense.
Note that the Search and Pounce window is local to the station and not networked.
Just as with the Partner window, Callsigns with frequency are added to the window with [Alt][Enter]
Except for also remembering the frequency and that double-clicking an entry does not delete it,
the window behaves like the Partner window.
If both the Partner window and the Search and Pounce windows are open, the operating mode will determine which one is used.
The Partner window will be used in RUN, and the Search and Pounce window will be used in... S&P.
Summary
Shortcut: [Alt][S]
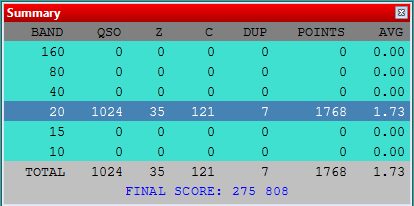
The summary window displays the number of QSO (which does not include the dupes), along with multipliers relevant
to the contest type for each band in the blue section, with the dark blue strip showing the current band being operated.
Important: The Points and Multiplier counts may not include bonuses whereas the total score does.
Important: The QSO count includes X-QSO but excludes dupes.
Grey section at the bottom shows totals for the contest and final raw score.
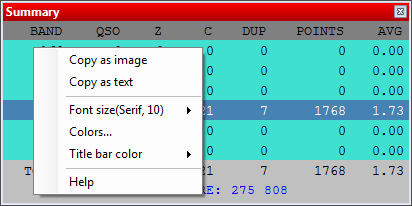
The right mouse click context menu allows you to copy the scoring summary data in the clipboard as an image or as a text file.
Rate
Shortcut: [Alt][R]
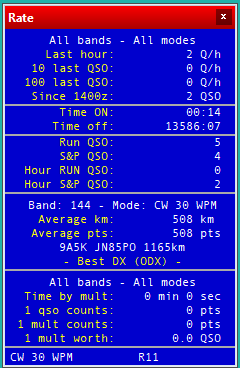
The panel displays live QSO rate data for the current contest log.
The top section shows QSO's in last hour, last 10 QSO rate, last 100 QSO rate,
rate for the current hour so far and, if enabled in the context menu, a projected score.
There is also a menu option for additionally showing the rate over the past 10 minutes.
If a target file is loaded, a final projected score can be displayed.
The second section shows time on and time off in hours and minutes. The minimum off time
defined in the rules for the current contest is used in this calculation.
Important: Since DXLog does not know the starting time or duration of a contest,
the on/off time calculation starts and ends with the first and last QSO. This means that
if you do not join the contest from start, or end early, you will need to add this off time
time to the displayed off time manually.
The third section shows Run and S&P statistics. Both in total QSO count and the count since
the last full hour.
For a contest entry with band change limitations, the next section displays these.
For a contest with QRB-based scoring, the next section displays distance statistics.
The second to lowest section shows time since last multiplier, multiplier and QSO points worth.
Important: The calculation of multiplier points does not include factors like bonuses.
The last section shows operating mode and audio focus status.
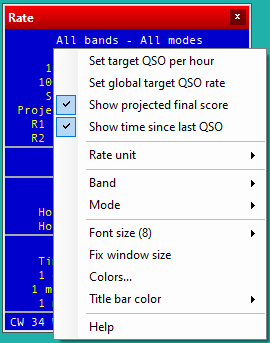
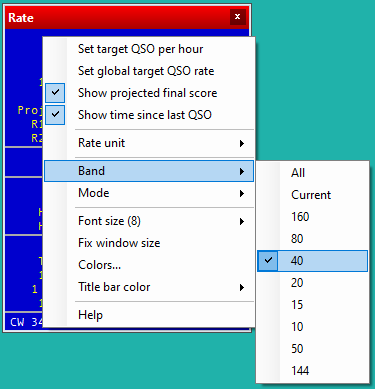
The right-click menu allows you to configure the Rate window.
Target QSO per hour is the expected number of QSO per hour. When set, the Rate window will display the
different between the resulting target QSO count and the actual QSO count for the current hour.
It resets at the top of the hour.
The global QSO rate is the expected number of QSO per hour during the entire contest. When set,
the Rate window will display the difference in QSO count and rate versus this target.
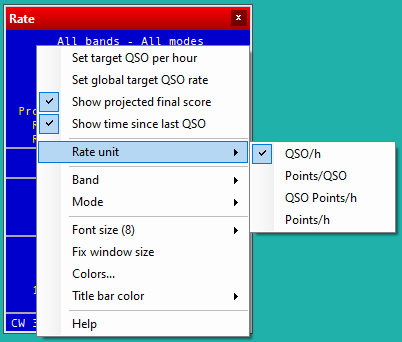
You can set the displayed rate unit.
It is also possible to display the rate per band or mode.
Operating info
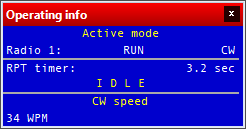
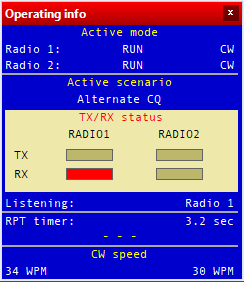
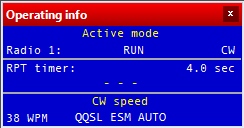
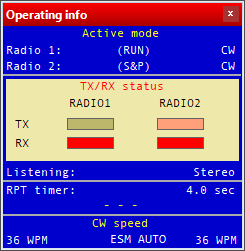
Operating info window displays the radio active mode, if in SO2R it will display Radio 1: and Radio 2:
The CW repeat timer interval and the CW speed set in DXlog.
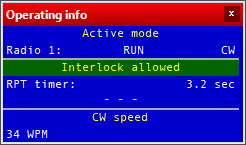
If you software interlock is active, the interlock status will be shown in the Operating info window.
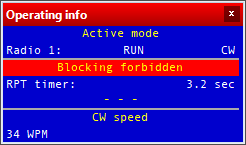
Interlock blocking can be forbidden by clicking on the Interlock status line as shown below.
Interlocks can also be controlled by the $PILOCK (forbid) and $AILOCK (allow) macros.
The current interlock status/activity is shown in the Radio status window.
In SO2R Advanced mode the window will also show the currently active scenario.
Double-clicking the scenario name will bring up the scenario editor.
The Operating Info window also shows the current status of Intelligent Quick QSL, ESM, and Auto-CW.
If RUN/S&P switching is disabled, this is indicated with parentheses.
Contest statistics
Shortcut: [Ctrl][F9]
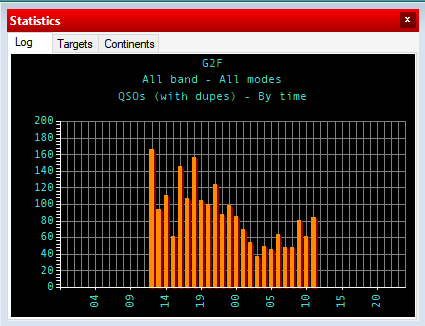
The statistics window is a powerful tool for monitoring the station rates by band, mode, overall and optionally
against a pre-loaded target created from a previous year or competitor's previous public log.
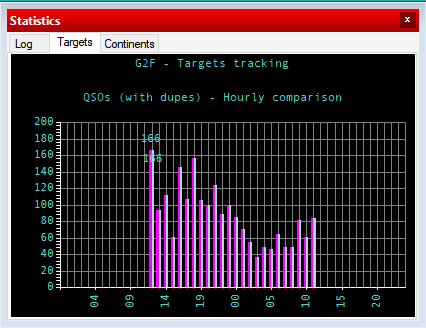
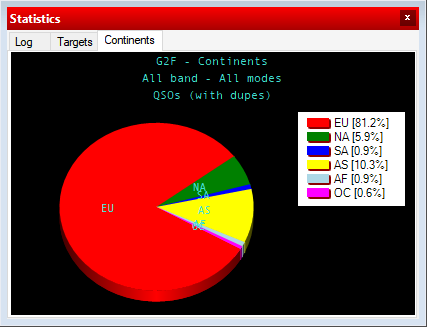
There are three tabs, the first is the current log data, the second is comparison of the current log against
a pre-loaded target file and the third is % of continents worked for the log total.
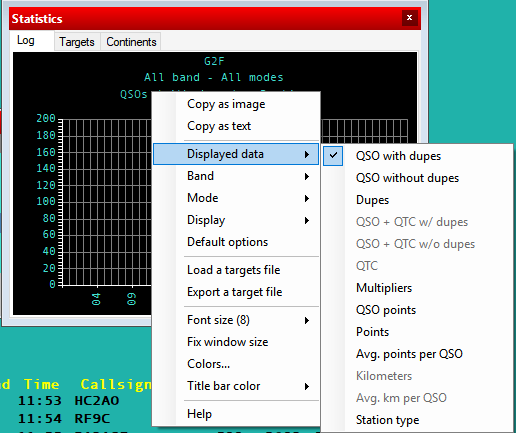
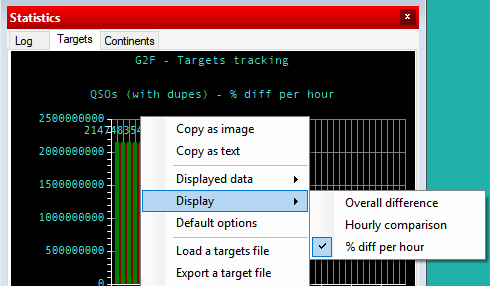
Right clicking on any of the 3 tabs gives access to the tabs display options.
Without any logged QSO, the graphs may not show any meaningful information.
Log Tab Options
It is possible to copy any of the Statistics windows as image or text to the Windows clipboard.
This data can then be transferred into text document, Excel® or OpenOffice spreadsheet for further analysis during or post contest.
- Displayed Data
- Select which kind of data to display: QSOs, Multipliers, QSO Points, etc.
- Band
- All (total): Single color display, all bands combined
- All (detailed): Multicolor display, one color per band
- Current: Displays statistics for the current band
- According to QSO: Displays statistics for the band of the currently selected QSO
- Mode
- All (total): Single color display, all modes combined
- All (detailed): Multicolor display, one color per mode
- Current: Displays statistics for the current mode
- According to QSO: Displays statistics for the mode of the currently selected QSO
- Display
- By time: Displays an hour by hour comparison
- Overall: Displays a cumulative (overall total) comparison
Target Tab Options
- Displayed Data
- Select which kind of data to display: QSOs, Multipliers, QSO Points, etc.
- Display
- Overall Difference: Displays the overall difference to the target
- Hourly Comparison: Displays a Comparison per hour + or - the target
- % Diff Per Hour: Displays a Percentage Difference + or - the target per hour
- Export a target file: Exports the currently loaded log to a *.obf file for use as a target file.
- Load a target file: Loads a previously created *.obf file for use as a target file.
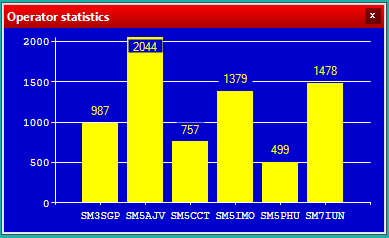
Operator statistics
A resizeable window showing the operator QSO statistics.
QSO without a logged operator are counted as the station's callsign.
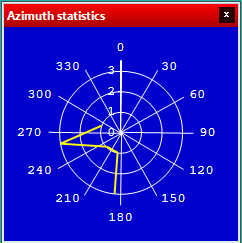
Azimuth statistics
A resizeable panel showing the direction statistics of all QSO in the log as a spider web diagram.
The menu item is only visible for logs with distance-based scoring.
Gab
Shortcut: [Alt][I]
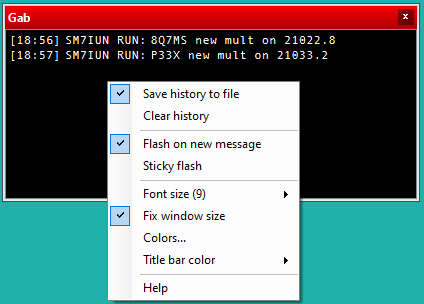
The Gab window displays the chat between networked stations.
In the context menu,
- Save history to file will save the gab chat history in a .gab file for the current contest.
- Clear history will do exactly what it says.
- Flash on new message will briefly change the background color of the Gab window with all incoming messages.
- Regardless of this setting, messages containing "!" will always trigger this visual alert.
- Sticky flash will make the alert background color stay until confirmed. Confirmation is done either
- by sending a response or clicking anywhere inside the Gab window.
ALT+G opens a chat dialog for sending messages. It offers the option of either broadcasting
or directing the message to an individual station.
Double-clicking on a station name in the Status window will open the same chat dialog,
with the selected station's name as the selected destination. Double clicking your own station name will select
all stations as destination.
Network status
Shortcut: [Alt][J]
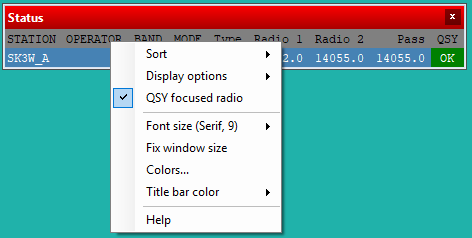
The status window indicates the status of each station connected to the network.
From left to right, are displayed:
Station name, Current band and mode, Station type, QSY frequency of the current band and mode, Radio 1 frequency, Radio 2 frequency,
Time left before a possible QSY, according to the 10 minutes M/S rule, or "OK" if the station is allowed to make a
QSY on another band (only appears if the contest specifies this particular rule).
Your own station is displayed in a deep blue background.
A double left click on a station name will display the chat ("Gab") dialog with this station as the preselected destination.
A double left click on your own station name will display the chat ("Gab") dialog with ALL as the preselected destination.
With QSY focused radio unchecked a double left click on a valid frequency will set the VFO A on radio 1 to this frequency.
With QSY focused radio checked a double left click on a valid frequency will set:
- The currently selected VFO to this frequency in SO1R and SO2V
- The currently selected VFO on the focused radio to this frequency in SO2R
The context menu is accessed by right clicking the display part of the window.
The Station ID may be changed in Options|Configure Network even if networking is disabled.
The Display options sub menu has the following options:
- All bands - shows stations on all bands if checked.
- Support stations - shows also support stations if checked.
- Radio 2 information - shows the below information also for radio 2.
- Band - current band.
- Mode - current mode.
- Pass frequency - pass frequency.
- Logged on operator - logged on operator.
- Callsign - callsign entered.
- Serial number - current serial number.
- Message ID - ID of message being sent.
- Message text - CW or digital text being sent.
Skeds
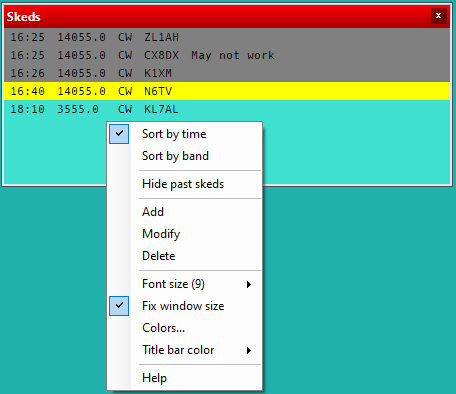
Passed stations and scheduled QSO are listed in the Skeds window.
Recently added or skeds occurring soon have a bright yellow background, past skeds have a grey
background and future skeds have none.
- Double click on a list entry to QSY to its frequency.
- Hold down
[Ctrl]and double click on a list entry to delete it. - Hold down
[Alt]and double click on a list entry to QSY to its frequency on the second VFO
- or the other radio in SO2R if
Operating|Bandmap|QSY opposite radio instead of 2nd VFOis checked.
Right click on the window for a context menu (as shown below) to add, edit, and delete skeds.
There are also sorting options and for hiding past skeds.
For more information on how to populate and use the Skeds window, see the Pass a station section.
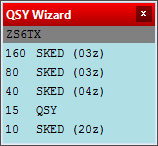
QSY wizard
The QSY wizard can be used with or without HamCAP installed and running.
One of its most important uses is for passing multipliers to other bands.
The Pass station panel is opened when clicking a band in the QSY wizard.
Operation with HamCAP is strongly recommended since it then offers real time
recommendations on contacts on other bands (QSY or sked).
(Options|HamCAP|Tab must be set to Charts.)
If used without HamCAP, it will always show "SKED" but is still very useful since
it offers single-click passing of e.g. multiplier stations to another band.
The QSY wizard is refreshed manually by pressing [Ctrl][P] with a valid
call in the entry field or automatically by checking the menu option
Options|Networking|Show QSY notification in QSY Wizard.
HamCAP can run in the background to avoid consuming screen real estate.
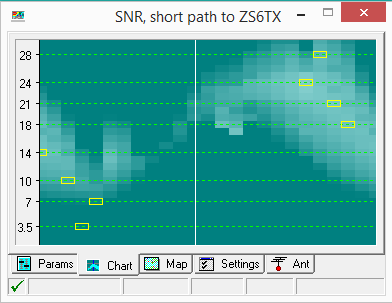
The wizard's recommendation (QSY or sked) will be based on HamCAP's propagation prediction.
In the above example ZS6TX has been worked on 20m. After pressing [Ctrl][P] the
wizard tells us that 15m may be promising for a QSY.
For 10, 40, 60, 160m, however, the wizard instead recommends a sked.
This is the best time predicted by HamCap for this path. Hovering the mouse cursor over the yellow square
on the Hamcap chart will give more information including the MUF and signal elevation etc.
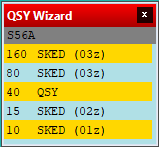
Bands for which a multiplier is needed are highlighted using a diffrent background color.
In the picture below S5 is needed 160, 40, and 10m.
The the colors used are selectable via the right click context menu Colors.
Clicking on a band line brings up the Pass a Station panel filtered pre-populated for the clicked band.
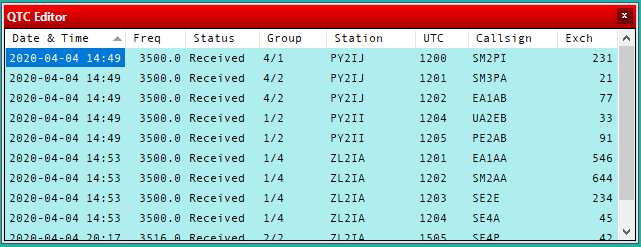
QTC Editor
This window allows editing of QTC (as used in e.g. WAE DX contest) in ways not possible using
the regular receive and send QTC windows mechanics. Double click an item to modify it.
The right-click menu offers additional features, such as scrolling to the top or bottom and searching for a station callsign.
Clicking the column headers enables sorting.
Extra Information
The Extra Information window displays information contained in a text file based on the call entered in the
log callsign entry field. Files should have the .xdt file extension.
The format of the Extra information file is very simple:
- #TITLE Name of info
- K6MR Ken #1270 Anderson CA
- K6NA Glen #548 Valley Center CA
- K6NR Dana #2380 Irvine CA
- K6NV Bob #675 Truckee CA
- K6PB Pete #2469 Irvine CA
For proper display of non-ASCII characters, make sure the file is UTF-8 encoded.
The text following #TITLE keyword will be shown on the window's header.
If the #TITLE line is omitted, the complete path and filename will be shown.
Data lines (one per call) begin with the call sign and a single space.
Any information present after the first space will be shown exactly as formatted in the file.
Multiple files may be used to show data from different sources.
- To add a file - Right mouse click in the extra information window and select "Extra data files".
- Click 'Add' and select the file from the file selection form.
- To remove a file - Right mouse click in the extra information window and select "Extra data files",
- select the file to be removed, and click 'Remove'.
If a file is updated while open in the window, right click and select "Reload files" to use the new data.
The window is also used to display the result of online look-ups from hamQTH and QRZ, configured via
the Options|Data files|Extra info plugins menu.
A selection of XDT files for download can be found on the DXLog.net web server.
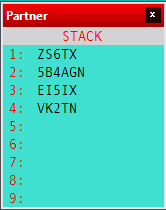
Partner
This feature is especially useful in a Multi-OP environment when facing large pile-ups and/or weak signals.
Set up an additional operator, as support with an additional computer which has the same version of DXlog installed.
Connect a pair of headphones to the same receiver as the operator, then on both comptuers open up the Partner window,
on the partner computer enter the same band and mode as the run station. Note that deleting the call on the partner
computer when grabbing is optional.
Networking needs to be enabled on all stations.
The running operator continues as before, working the callsign he hears.
The support operator listens at the same time and tries to copy additional callsigns from the pile-up
by entering the callsign on the QSO entry field and then pressing Alt-Enter.
This callsign will now be displayed in the Partner Window stack for the running operator to use as his next contact.
The Partner window can hold up to nine callsigns which can be grabbed into the callsign field with [Alt][1] to [Alt][9].
Once the QSO is logged, that callsign will disappear from both partner windows.
The partner can remove a callsign if incorrect or no longer valid using [Alt][1] to [Alt][9].
A field in the partner window can be overwritten with a new entry by using [Ctrl][1] to [Ctrl][9].
Partner window use in RTTY
The Partner window is also useful when used in a RTTY environment.
In addition to using [Alt][1-9] and [Ctrl][1-9], calls may be entered onto
the stack by selecting a call in the RTTY receive window using the mouse pointer.
Two callsign selection methods are available:
- 1.
[Alt][LeftClick](left mouse click while holding down the Alt key) - 2.
[MiddleClick](pressing hte scroll wheel click on most mice)
Subsequent selections in the RTTY receive window will populate the next empty line in the Partner window.
To place calls from the Partner window stack into the active QSO line, the $GRABPARTNER macro can be used
in a message to grab the first call from the Partner window stack.
Typically this can be used in a special TU message to confirm the current QSO,
enter the next call, and send the report, e.g.:
$13 $CORRECT TU $GRABPARTNER NOW $LOGGEDCALL $F2 $CR
Multi Partners and real time updates
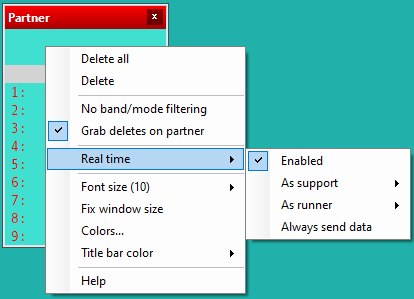
The partner window can also be set to display the typing done by support stations in real time.
Right click on the window and select Real time|Enabled. This option will give you up
to three additional lines at the top of the window that will reflect the typing of your partner stationn.
Normally the only the run stations displays the typing of the support stations but by checking the
option Always send data will make the station broadcast its typing to other partners regardless of role.
The options for real time are for the runner or the support, as runner you can have a live entry field that is
1, 2 or 3 slots long. As support you can select to post into either of the 3 slots, this gives the option of up
to 3 support stations each with a specific line to update live as the callsign is typed on the support station.
When Always send data is checked, both the runner and support options are valid.
Partner window use for M/2
For M/2 stations the station type - partner is grayed out, each station can have up to 3 partners, the partner window
should be set to real time and the partner stations on the same band and mode as the run station.
No Band/Mode Filter option
With this option checked all callsigns entered from support stations irrespective of band or mode will be displayed.
Radio status
The radio status window shows the transmit and interlock status of each enabled radio.
When successfully transmitting, this is indicated by a green bar.
When blocked, this is indicated by a red bar which also includes information
about the source and reason of the blocking.
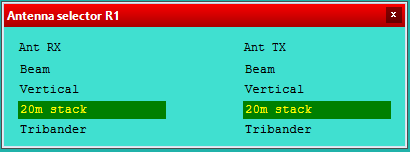
Antenna selector R1/R2
The antenna selector windows are showing the available antennas for the chosen band for each radio.
DXLog's antenna selection mechanics can use a microHAM keyer with an ACC port (e.g. MK2R+),
an OTRSP device with at least two Aux ports or a parallel printer interface (i.e. LPT port).
The band/antenna association, required control pin values, and operator friendly name
are set up in the configuration panel for the used device.
- microHAM configuration:
Options|microHAM configuration - OTRSP device configuration:
Options|OTRSP device configuration - Printer port:
Options|Configure interfacesPrinter port Setup
For more detailed information on how to configure each interface, see microHAM configuration,
OTRSP device configuration, and Printer port configuration.
With a microHAM keyer it is possible to use a different antenna for receive and transmit.
To enable this functionality Options|Interface specific options|Allow different RX/TX antenna must be checked.
Different antennas for receive and transmit when using an OTRSP device or printer port is not supported.
Important: Using a different antenna for receive and transmit only works when DXLog either exclusively controls, or is
aware of, the transmit/receive status, e.g. through a footswitch.
Tip: For microHAM devices DXLog is aware of the keyer's PTT status if Enable TX lock/unlock is checked.
Important: Cross band operation is not supported. The band of VFO A always determines the antenna selection.
It is possible to have several antennas for each band (as well as antennas covering multiple bands,
such as a triband yagi or a trap vertical).
All allowed antennas for the current band are listed. The selected antenna is highlighted.
The last used antenna on a band is not remembered. When switching to a new band, the first
allowed antenna listed in the configuration will always be selected.
The antenna selection can either be made through keyboard shortcuts [Alt][F11] (receive or transceive antenna)
and [Alt][Shift][F11] (transmit antenna) or by clicking on the name of the desired antenna in the window.
Antenna controller R1/R2
Only visible when using a networked antenna server.
Antenna rotator R1/R2
The Antenna rotor R1 and Antenna rotor R2 windows links with an external rotator software using UDP messages for setting the desired direction as well as showing the current direction.
The window takes the information from the rotator configuration window for band, rotator, IP address and UDP port of the rotator server.
The windows link nicely with PSTrotator, in PSTrotator the UDP control setup must be set to the same UDP port as the rotator in DXL for the relevant band.
UDP control must be enabled in PSTrotator, then when a band is selected that has a rotator in the rotator onfiguration the window will show the AZ for that antenna.
Turn the rotator by either inserting a callsign, a prefix, or an azimuth in degrees into the log entry line and press [Ctrl][F12] for SP or [Alt][F12] for LP.
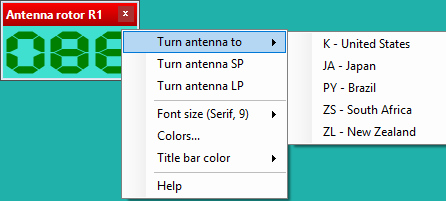
Right click on the window to access the context menu, the menu has turn antenna to - with a list of basic directions.
World Map
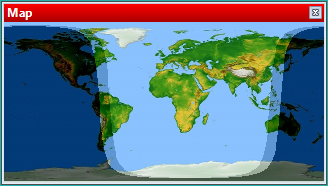
A color world map showing the current distribution of daylight and the location of the greyline.
Unlike most other DXLog windows, the World map can be resized.
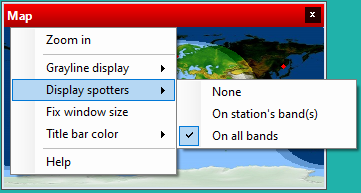
The properties of the map can be configured by right-clicking on it.
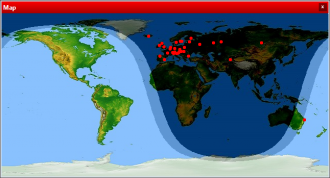
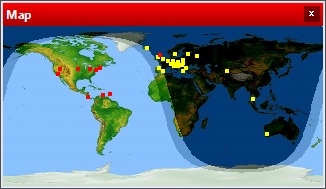
The map can show the location of stations and skimmers spotting the own station's call.
The spots fade when they reach the age of the spot lifetime set in the bandmap properties panel.
By default, spots on the band of radio 1 (or of any band, when all bands are displayed)
are red and spots on the band of radio 2 are yellow.
Either only spots on the station's active band(s) or on all bands can be shown.
The size of the map can also be changed using the zoom option in the right click menu.
VERY IMPORTANT When using this function, it is essential that the DX cluster node connected
to is set up to forward all spots of own callsign. Otherwise the display will not be reliable.
- DXSpider - Make sure the node you connect to is version 1.57 build 434 or later.
- Send the command SET/SEEME to make all spots of the logged in call pass through unfiltered.
- CC Cluster - Send the command SET/OWN to make all spots of the logged in call pass through unfiltered.
- AR Cluster - If you are using filters, make sure to add an exception for your own call, e.g.,
- ...OR CALL=SM7IUN (If you are SM7IUN, that is)
Note that you need to log on to the cluster node with the station's call for the above features to work.
Band notes
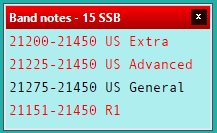
A user configurable window that shows information about the current active band.
It can be used to show license band segments, antenna tuner or PA settings, etc.
DXLog looks for configuration information in two places.
- The first place is the directory of the current log file. DXLog looks for a file with the same name as
- the log file but ending with _BandNotes.txt, e.g., CQWW2023_CW_BandNotes.txt
- The second place is the %appdata%\DXLog.net configuration directory.
- DXLog looks for a file called BandNotes.txt
If none of these files exist, DXLog uses a standard file that is part of the installation.
The formatting of the band notes file is as follows:
- Blank lines or lines beginning with a hash symbol are ignored.
- The structure of a line is Mode;Lower Freq;Upper Freq;Color;Text
- The keyword ALL matches any mode.
- A line is highlighted if the frequency of the currently focused radio falls within its range and has the right mode.
- The color is a number between 1 and 5 and can be changed in the Band Notes window's color settings.
- If color is followed by the letter H it is hidden when the frequency is not in range.
- If the color is followed by the letter N it is never highlighted.
- The color number can be followed by both H and N, e.g., 5HN.
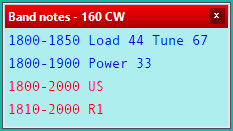
One obvious application of this panel is PA settings, like shown below.
Since this is not contest-specific information it is best stored as %appdata%\DXLog.net\BandNotes.txt
Example file content:
# 160m
ALL;1800;1850;3H;Load 44 Tune 67
ALL;1850;1900;3H;Load 47 Tune 65
ALL;1900;1950;3H;Load 52 Tune 62
ALL;1950;2000;3H;Load 55 Tune 59
CW;1800;1900;3H;Power 33
CW;1900;2000;3H;Power 35
SSB;1800;1900;3H;Power 27
SSB;1900;2000;3H;Power 29
Radio 1
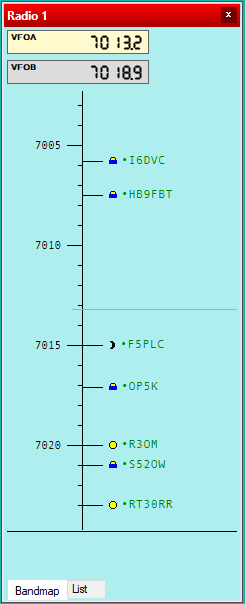
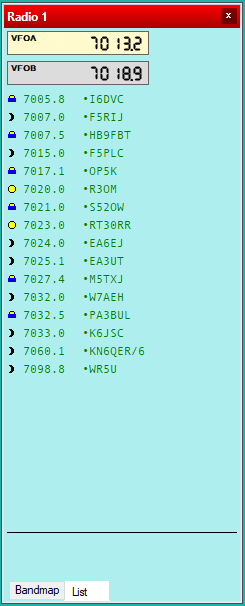
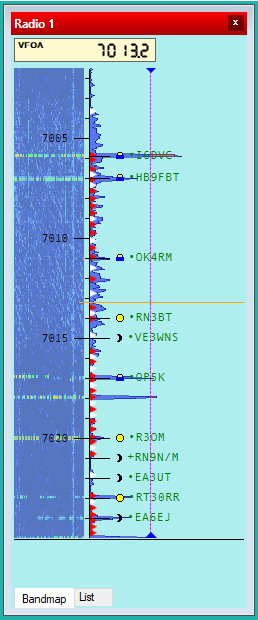
Radio information displaying VFO A and VFO B frequency information.
Click on the VFOA and VFOB boxes to switch to select the respective VFO.
Note: If you have automatic RUN/S&P selection enabled, a switch of VFO will change operating mode to S&P.
For convenience, it is recommended to combine this option with the option F1 always return to Run.
The Band map tab shows the currently selected radio band and any DX Cluster received or locally
entered callsigns plus other optional information.
Note: Callsigns preceded by a star are spotted by a preferred source. Callsigns preceded by a bullet
are skimmer spots. Callsigns preceded by a plus sign are manual spots. Callsigns preceded by a delta "Δ"
are split ("QSX") spots, receiving on a different frequency. Operator entered spots have no leading symbol.
Note: Only spots valid for the current contest entry are displayed. For instance, in a CW contest,
only CW spots are displayed. The exception is beacon spots, which are always displayed. The presence
of beacon spots can be set by sending text commands to the cluster node. For instance, for CC cluster nodes,
the command is SET or UNSET/BEACON.
The List tab shows a list of call signs which can be sorted in several ways.
In the list mode an colored bar will show the position of the currently selected
VFO and an underline indicates the position of the unselected VFO.
The default coloring is: RED = Double Multiplier, GREEN = Multiplier, Black = Unworked, GREY Italics= Worked
Information below the horizontal divider is available multiplier numbers, available QSO count, and points available.
Double clicking on a callsign sets the focused radio VFO to that frequency and mode
(including split if such information is provided in the spot comment) and puts the callsign
into the log callsign field. This can be changed to a single click by
selecting the enable single click selection from the context menu.
Double clicking while holding down [Alt] will grab the spot to the other VFO.
If the option Operating|Band map|QSY other radio instead of 2nd VFO
is checked, the spot is grabbed to other radio.
Double clicking while holding down [Ctrl] will erase the spot.
Clicking inside the displayed spectrum will set the VFO frequency. Alt-clicking will set the
secondary VFO frequency.
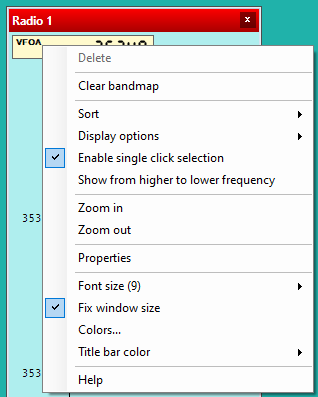
Context menu
A right click anywhere in the band map will bring up the context menu. Band map options are
changed by selecting the appropriate menu.
Most menu selections are self explanatory.
Show from higher to lower frequency will show the higher band segment edge at the top.
The default band map display is to show lower frequencies at the top, higher frequencies at the bottom.
As you tune up the band, the band map will move up as the cursor points to a higher frequency.
If you would prefer that the band map show higher frequencies at the top (with resulting movement
down as you tune up the band), check this option.
Tip if you use upper sideband in CW, leave the bandmap in the default direction.
This will make movement in frequency "up" correspond to an increase in pitch, which will fit
intuitively with shortcut keys such as [Shift][Up].
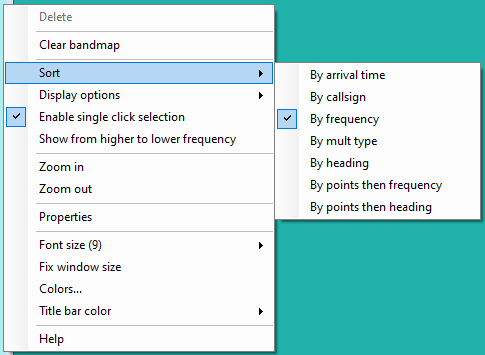
In list mode the data can be sorted in a number of ways. This is set with the context menu.
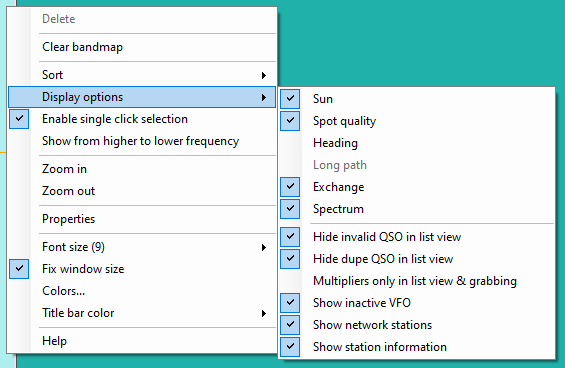
Display options for both Band Map and List mode are set by right-clicking the pane and selecting Display options.
Note that when Multiplier only in list view & grabbing is enabled, [Ctrl][Up] and [Ctrl][Down]
will only grab multiplier spots. Using the mouse or [Ctrl][Space], any spot can still be grabbed.
Important: Display options have no effect on beacon spots.
Quality tag will indicate spot callsign reliability, also known as quality tags, reported by some cluster nodes.
A large variety of tags and metrics reported are consolidated into three: ? for unreliable, P for probable, and V for verified.
More information on spot quality tags can be found in the sections about AR 6, DXSpider, and N2WQ clusters.
Propagation tag will display propagation forecast tags reported by N2WQ cluster nodes.
Their meaning are described in the section about support for N2WQ cluster nodes.
Exchange will show a guessed exchange.
Spectrum enables the display of a real time spectrum overlaid on the bandmap.
It requires a supported radio or external SDR. An example display is shown below.
The option Show station information will show information from the most recent spot of the currently
selected/highlighted callsign at the bottom of the bandmap, replacing the available QSO information.
Checking Enable single click selection means a single click on a spot will grab it.
Double click activates radio means that the radio associated with the radio is selected
when double clicking a spot.
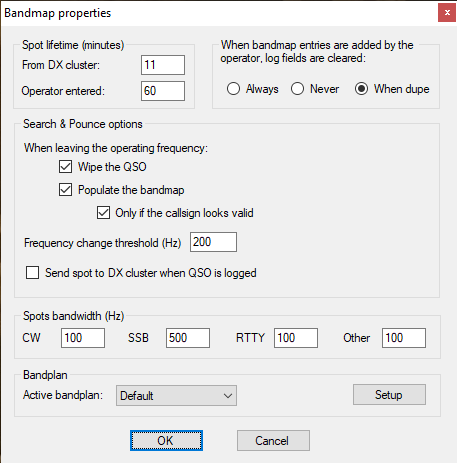
Various properties can be set by a right mouse click in the band map and selecting Properties.
Since the respotting time of the RBN is 10 minutes, using a cluster spot lifetime below this
in a CW or RTTY contest is a bad idea.
You can select up to four preferred spotter/skimmer callsigns. Enter the base callsign and do not
include skimmer suffixes. Stations heard/spotted by preferred spotters are highlighted in the bandmap
and the DX cluster announcements window.
Important: The Wipe QSO setting is prone to false triggers and may clear the entry line
also when not wanted, such as when using keys such as [Alt][F4] or [Shift][Ctrl][F1].
Bandplan settings
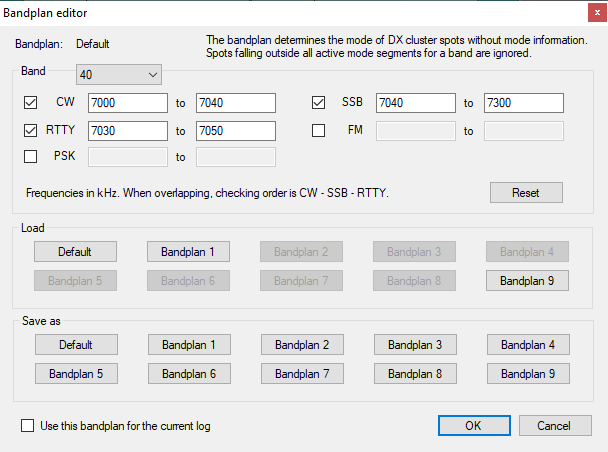
The Bandplan Settings panel is accessed from the Properties form.
Important: The sole purpose of the bandplan is for guessing the mode of spots that do not explicitly
show their mode in their comment.
Click Setup in the bandplan section of the Properties panel to display the current bandplan settings.
The current band will be displayed by default. Be sure to save changes to a Bandplan memory (Default, or Bandplan 1 through 9).
Note that clicking OK will save any changes to the currently active bandplan.
To edit a different bandplan than the one currently active, click its button in the Load button group.
If a bandplan has no settings, its Load group button will be grayed out.
To use a new Bandplan memory, save the current settings by clicking its button in the Save as button group.
Modify as required and save using the same button.
The Reset button will reset the Default bandplan to its original settings and select it.
If you wish to activate the currently selected bandplan, check the box in the lower left
corner of the form before you click OK.
Important: Spots falling outside all of the defined mode segments for a band will be ignored, regardless of their comment.
The mode of a spot is determined either by an explicit tag in beginning of the spot's comment ("SSB", "CW", etc.)
or, when this is missing, by the bandplan segment it falls within. In the case of overlapping mode segments,
the search order is: CW, SSB, RTTY. The first segment found that includes the spot's frequency determines its mode.
Mode checking is enforced based on contest entry category. In a single mode entry, only spots of the contest entry's
mode are displayed. In a mixed mode entry, spots for all the allowed modes are displayed.
This means that spots with an explicit mode tag, falling within any of the band's mode segments, and relevant
for the contest entry, will be displayed.
It also means that for spots without an explicit mode tag, only spots falling within the band segments relevant
for the contest entry will be shown. Spots without an explicit mode tag are often manual spots or spots received from a
local skimmer. This makes it important to sometimes adjust the bandplan.
Example: For a massive CW contest like CQ WW it may be a good idea to extend the CW segments in your bandplan, e.g.
14000-14125 for 20m. For a CW contest like this, skimmer spots (which all have a mode tag) will be displayed regardless of
frequency as long as they are within any of the active mode segments (SSB etc.) for the band.
Human spots (or others lacking a mode tag) will however only be displayed if they fall within the CW segment for the band.
The exception is however for spots CW originating from the Telnet ports of RBN Aggregator and CW Skimmer Server.
They will always be considered CW spots and not be subject to the bandplan rules.
The bandplan's frequency ranges thus serve two purposes:
- Spots not falling inside any of the mode frequency ranges will be ignored
- Spots lacking mode information will be assigned a mode based on the frequency range they fall inside.
For more information about handling spots, see DX Cluster options
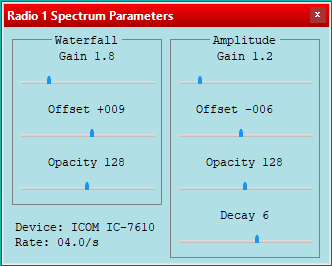
Radio 1 spectrum parameters
Resizeable panel for configuring the display of spectrum data in radio 1's bandmap.
Radio 2
All properties and settings are as per Radio 1. In SO2R this panel represents the second radio, in SO2V it represents the radio's second VFO.
Radio 2 spectrum parameters
As per Radio 1. In SO2R this panel represents the second radio.
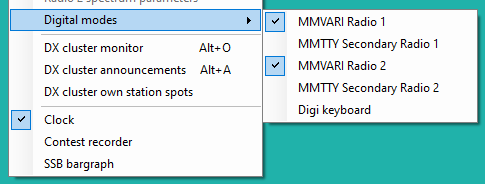
Digital modes submenu
There are four digital decoder windows (two for each radio), each enabled by selecting separately from the Windows menu.
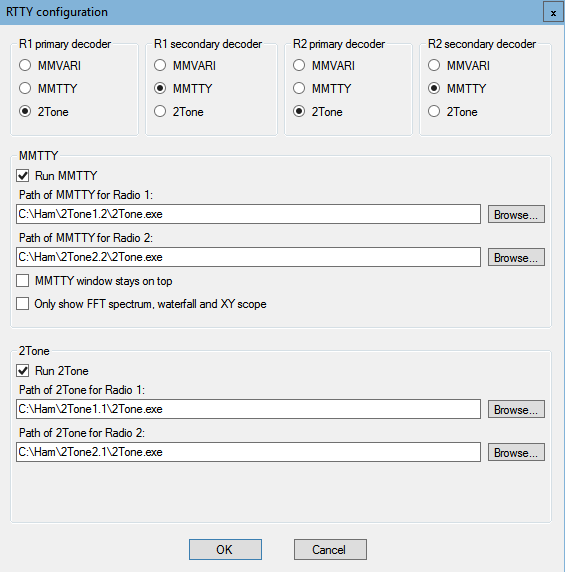
The four selections are located just below the Radio1/Radio2 band map menu picks, and the exact wording is dependent on the RTTY Configuration.
IMPORTANT: Radio 2 windows will only be active if SO2V, SO2R or Advanced SO2R are enabled in Operating|Technique.
Before using the decoder windows, they must be configured using the RTTY Configuration panel: Options|RTTY Configuration
After configuration, each decoder window menu selection will show which decoder has been configured, for each selection (Primary/Secondary)
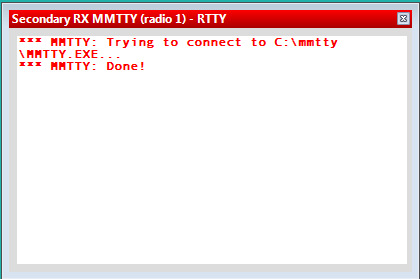
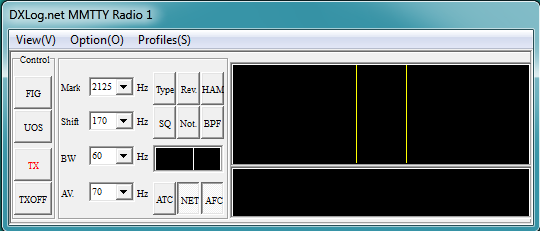
and radio (Radio 1/Radio 2). Note that the Primary decoder is the decoder used for the transmit interface, usually MMTTY.
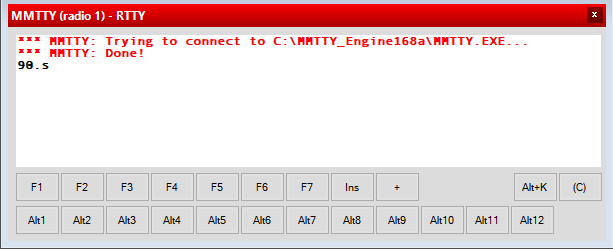
Selecting the appropriate menu pick will open the decoder window. The Primary decoder window will display a set of clickable buttons
at the bottom that duplicates all message function keys. The Altx buttons provide access to the messages defined in the
Alt-C (Other Messages) form. In addition, there is an Alt-K button (open keyboard mode window) and a (C) button (clear decoder window).
Callsign and exchange can be grabbed from the decoder window by clicking. Holding down [Alt] while clicking will grab a
call to the partner stack.
When the decoder windows are opened the first time, it will be necessary to configure each one for input and output parameters such
as sound card, FSK port, etc. These settings will be saved by the decoder program and only need to be configured the first time.
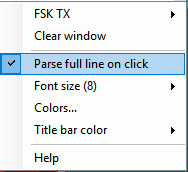
Right click on the main decoder screen opens the options dialog
Clear window will clear the receive screen characters.
When Parse is checked, it will parse full line and sends to other windows for processing.
For example, in QTC receive window, it will parse full qtc line and populate all fields (utc, call, serial)
Note: MMTTY will only save the FSK port settings if you close the MMTTY windows before closing DXLog.
If you let DXLog close the MMTTY windows the FSK port will reset to NONE and will need to be selected at the next use.
Example of MMTTY engine window.
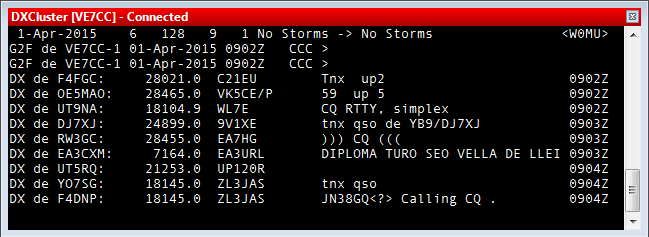
DX cluster monitor
Shortcut: [Alt][O]
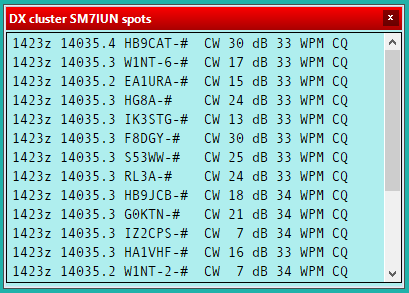
Floating window displaying live information from the connected DX Cluster as received.
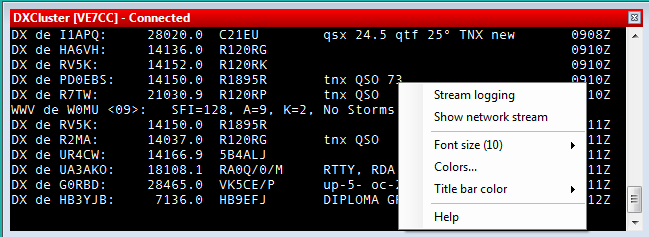
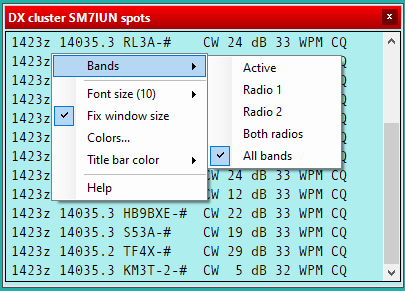
Right mouse click on the window for context menu.
- Stream logging
- If checked, will save all lines displayed in the window to the file %appdata%\DXLog.net\DXCStreamHistory.txt
- Important: This function is mainly intended for debugging and there is no automatic pruning of this file so it may grow very large with time.
- It is the responsibility of the user to prune or delete the file on a regular basis.
- Show network stream
- If more than one networked PC is in use, and you run a connection to DX Clusters
- on more than one of the PC's in the network, checking this option will show data from all DX Cluster
- connections in the DX Cluster monitor window, but with different color.
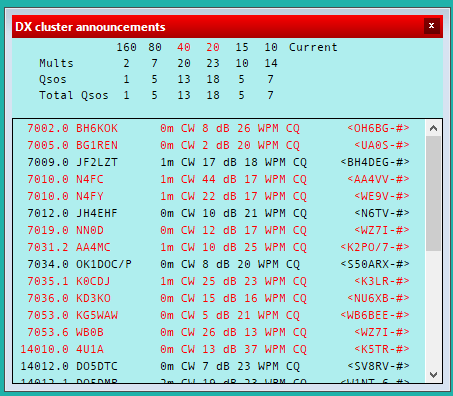
DX cluster announcements
Shortcut: [Alt][A]
This window shows received DX Cluster spots with total valid spots for Mult QSO's, Standard QSO's and Total
QSO's per band at the top of the window. Beacon spots are however not shown or counted.
Double click a spot and it will tune connected Radio 1 VFO A (or Main VFO of a Dual RX radio) to the
spot frequency and auto enter the callsign into the log callsign entry field.
If the spot contains QSX information, split will be enabled on radios for which split control is supported.
A QSX split is recognized by a leading delta character, "Δ".
Double click on a spot while holding down [Ctrl] to delete a spot.
Incoming spot logging can be useful when you want to analyze the spots post-contest. It also helps when
restarting DXLog, restoring your bandmap and DX Cluster announcements immediately. The log file can however
grow quite large and can be deleted if you find it impacts the performance of DXLog. The file is called
%appdata%\DXLog.net\DXCSpotHistory.txt.
For SO2V or SO2R mode: [Alt]-doubleclick on a spot will tune connected Radio 2 VFO A (or Sub VFO in SO2V with a dual
receiver radio) to the spot frequency and auto enter the callsign into the log callsign entry field.
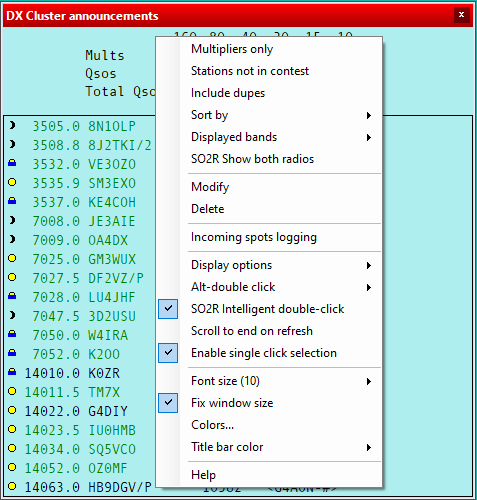
Spot display choices can be set by right clicking on the window and selecting from the context menu.
The window can display multipliers only, or spots for stations which can be worked in the current contest or stations
which may not be in the contest.
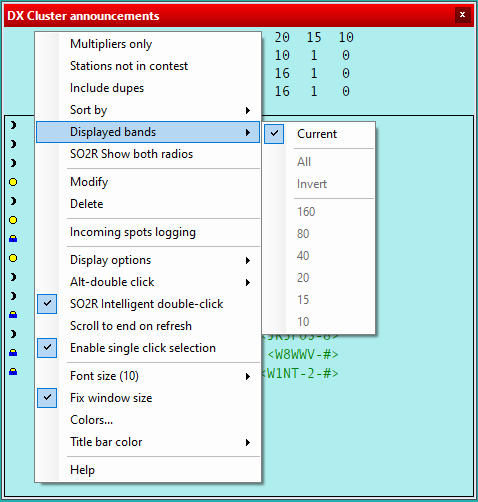
Spots displayed can be set manually per band or any number of bands or automatically from the connected radio band.
The "current" band is the band of the active radio. In SO2R and SO2V, this means the currently focused radio.
The active band(s) can be selected either using the right-click menu or by clicking the band/Current labels in
the upper part of the window. In SO2R Advanced, the active radio is selected by pressing [Keypad Multiply]
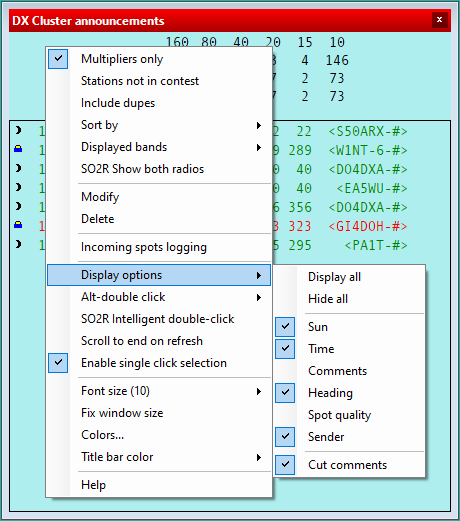
Information displayed in the window can be filtered using the context menu and selecting display options.
The callsign reliability ("quality") tag from some cluster nodes can be displayed. The large multitude
of spot reliability tags (B, C, P, Q, S, V, and ?) across various cluster node varieties are condensed
into three: ? for unreliable, P for probable, V for verified, and L for locally entered.
The propagation forecast tag from N2WQ cluster nodes can also be displayed. For good, medium, poor, and marginal
probability it is >, =, < or -, respectively. For anomalous events, the NOAA standard letters G (geomagnetic storm)
and R (radio blackout) can also be displayed.
More information on skimmer spot quality can be found in the section about AR 6 clusters.
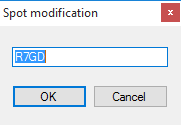
Incorrect spot callsigns can be modified by right clicking the callsign and selecting Modify from the menu.
Based on preference, you can select single-click selection, the default being double-click.
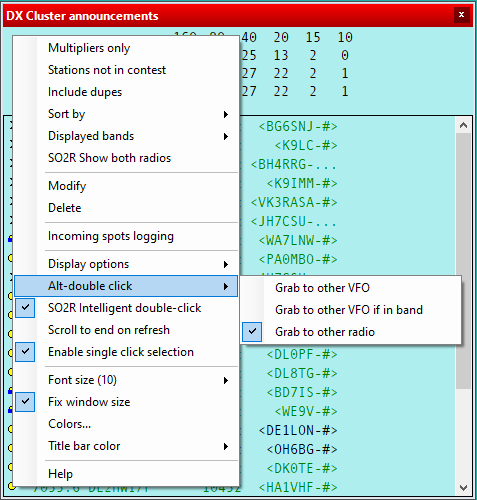
Double-clicking while holding down [Alt] offers several options for grabbing the spot to the other
radio or VFO.
Spots can be deleted by right clicking the spot and selecting Delete or by holding down [Ctrl] and
double-clicking the spot.
Spots can be sorted by in many ways. Most are self-explanatory but "SNR weighted by spotter" may not be.
It means SNR non-linearly reduced by spotter distance. In essence it means that SNR and spotter proximity
is combined into a priority.
Special features for SO2R
The DX Cluster Announcements window has two features targeting advanced SO2R users.
Checking the menu option SO2R Show both radios will show spots from both current bands in SO2R allowing
efficient use of SO2R Intelligent double-click which offers very convenient S&P on either of the radios.
Checking the option Double click activates radio will remove the need to manually change focus.
The "intelligence" is to do the below checks in sequence and act on the first one fulfilled:
If the shift key is pressed and the control key is not pressed use radio 1.
If the shift key and control key are pressed use radio 2.
If radio 1 is on the same band as the spot use radio 1.
If radio 2 is on the same band as the spot use radio 2.
If radio 1 is S&P use radio 1.
If radio 2 is S&P use radio 2.
If radio 1 has called CQ (F1 key) more recently than radio 2 use radio 2.
If radio 2 has called CQ (F1 key) more recently than radio 1 use radio 1.
Use radio 1.
DX cluster own station spots
Lists all spots of the own station's call on the DX cluster.
You have a selection of what spots to show, depending on your operating situation,
SO1R, SO2V/SO2R, Multi-single, Multi-two, or Multi-multi.
Spots on frequencies other than your current CQ frequency are shown in a different color (default grey).
Make sure to enable own spots from your cluster node. Read more in the World map section.
Clock
Time information bar, including Sunrise and Sunset times and the active station callsign
and the call of a logged in operator.
With default colors used, the text will turn
- dark red when the time is within 30 minutes of sunset or sunrise.
- clear red when the time is within 15 minutes of sunset or sunrise.
- dark red during the 59th minute of each hour.
- clear red during the first minute of each hour.
Left mouse click and drag to move. Right click on bar for options menu.
When Tools|Data entry|Enable Run/S&P switching is enabled the Clock bar will show the mode of
operation for each radio/VFO.
In Run mode the clock background is grey but in S&P mode the Clock bar background is yellow (If default colors are used).
Clock bar in run mode.
Clock bar in S&P mode.
Contest Recorder
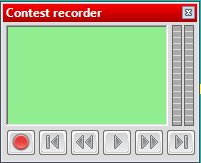
The contest recorder allows you to record two audio channels for a whole contest in MP3 format onto your hard drive.
The two channels can be radio 1 and 2 for SO2R or main and sub receiver for SO2V.
Since Windows does not come with a native MP3 encoder enabled, it is necessary to install a third party encoder.
The open source encoder libmp3lame.dll can be downloaded from http://www.rarewares.org/mp3-lame-libraries.php (see picture below) or
from DXLog's web repository http://dxlog.net/sw/files/utilities/libmp3lame-3.99.5x86.zip
Important: Download the 32 bit version. The 64 Bit DLL version does not work on Windows 7,8 or 10 64 Bit systems.
Extract the dowloaded archive file into DXLog installation directory which is usually C:\Program Files(x86)\DXLog.net
Important: For proper operation it is important that USB power management is disabled and that exclusive access to the
audio devices is also disabled. For more information, see HERE.
Encoding rate can be selected in a number of steps from 8kHz sample rate and 24kb/s coding rate to 32kHz sample rate and 96kb/s coding rate.
For most users 8kHz/24kb/s is adequate and the least consuming on storage.
The rate is set in the MP3 Configuration panel accessible via Options|MP3 configuration.
Recording levels are not set in DXLog, but in Windows' Recording Devices settings.
Signals should peak top yellow on the Contest Recorder bar graph display for best results.
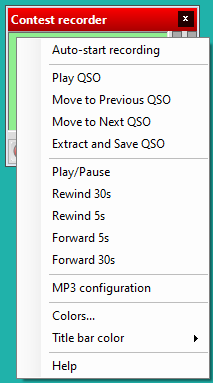
To playback or extract, select the desired QSO in the log, either by searching for the QSO number or manually selecting
using the up/down arrows, then right click on the contest recorder and select PLAY QSO. For more playback options use
the contest recorder right click context menu.
The menu option "Auto-start recording" is saved on a per-log basis and makes recording start automatically
after opening the log. The option is automatically disabled when the recording is stopped manually or if the
most recent QSO in the log was more than 6 hours ago.
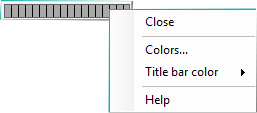
SSB Bargraph
Bargraph showing output of recorded files for Function Keys.
Drag to move
Right mouse click on bargraph for context menu.
